Custom Data Reporting & Visualization
- Home |
- Custom Data Reporting & Visualization
Custom Data Reporting & Visualization
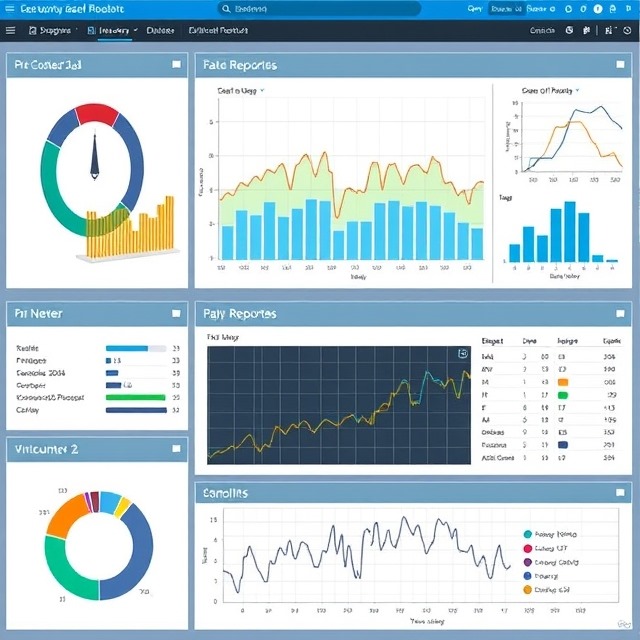
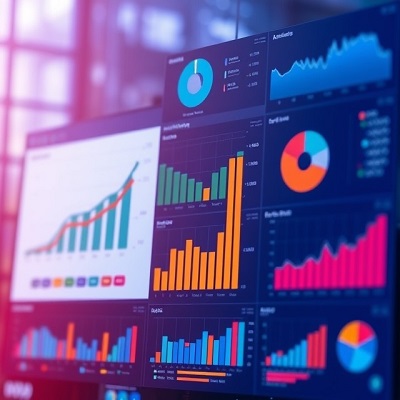
At Applied Automation, we provide custom data reporting and visualization solutions that transform complex data into clear, actionable insights. Our interactive dashboards and tailored reports allow you to monitor key performance indicators, track trends, and make informed decisions to improve operations. Whether for management, compliance, or operational optimization, our solutions deliver real-time visibility into your critical business metrics.
Have any questions? Please Contact +880 1732-646208
FEATURES OF Custom Data Reporting & Visualization
- Cost-effective solution.
- No human errors in data collection.
- Easy to configure & maintain.
- Helps to identify inefficient electrical equipment.
- Maximum Power Demand Analysis.
- Facility of viewing Real time electrical data & energy reports over Internet/Intranet.
- Graphical display of energy consumption.
- Significant Savings.
- Mitigate effects of future legislation.
- Open Opportunities for energy innovation.
- Metering your energy consumption and collecting the data.
- Finding and quantifying opportunities to save energy.
- Targeting the opportunities to save energy.
- Tracking your progress to save energy.

